

Monitoring and Analyzing Hardware Consumption of Ethereum Nodes Post EIP-4844
Monitoring and Analyzing Hardware Consumption of Ethereum Nodes Post EIP-4844
This article is attempting to monitor the hardware costs of running an Ethereum node with blob-carrying transactions.

Notice:
Node synchronization is still in progress (4 years of data remaining), so the current results do not yet include blob consumption. Therefore, the charts in the article will be updated as synchronization continues.
Introduction
Since the blob-carrying transaction is updated and becomes effective with EIP-4844, there is growing concern that home-based nodes will be required to pay additional hardware costs to store and propagate blob transactions. This is regarded as an inescapable trend toward centralization for the entire network.
Therefore, we are attempting to monitor the hardware costs of running an Ethereum node (consensus layer + execution layer) with blob-carrying transactions and declaring the specific costs for home-based node from different perspectives.
Node Configurations
In this article, we run an Ethereum node on a self-assembly computer. The main configurations of this PC are shown as below:
CPU: AMD R7 7700
Memory: 96GB DDR5 6400MHz
SSD: 512GB NVMe (for OS) + 4T NVMe * 2 (for two clients)
Network speed: 100Mb/s (wired connection)
The hardware specifications of this computer exceed the requirements for running an Ethereum node. In this article, we provide higher configurations to determine the maximum hardware threshold required for an Ethereum node. And the OS and software configurations are provided as following:
OS: Ubuntu 24.04 LTS
Execution layer client: Geth v1.14.5, running with
--syncmode "full"and--gcmode "full"Consensus layer client: Teku 24.4.0, running with
data-storage-mode: "archive"
The execution layer and consensus layer clients are installed and store their data into two NVMe SSD disks separately.
Monitoring Methodology
To ensure that the monitoring system uses minimal hardware resources, we have created a bash script to gather system information and scheduled it to run every minute using cron. The information we capture is listed below:
CPU:
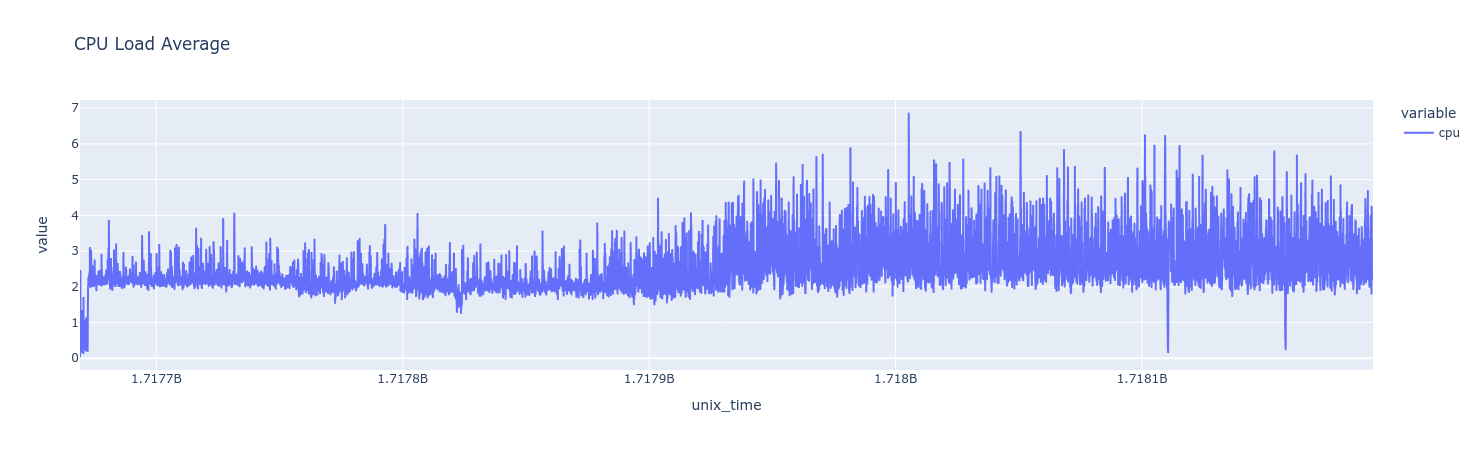
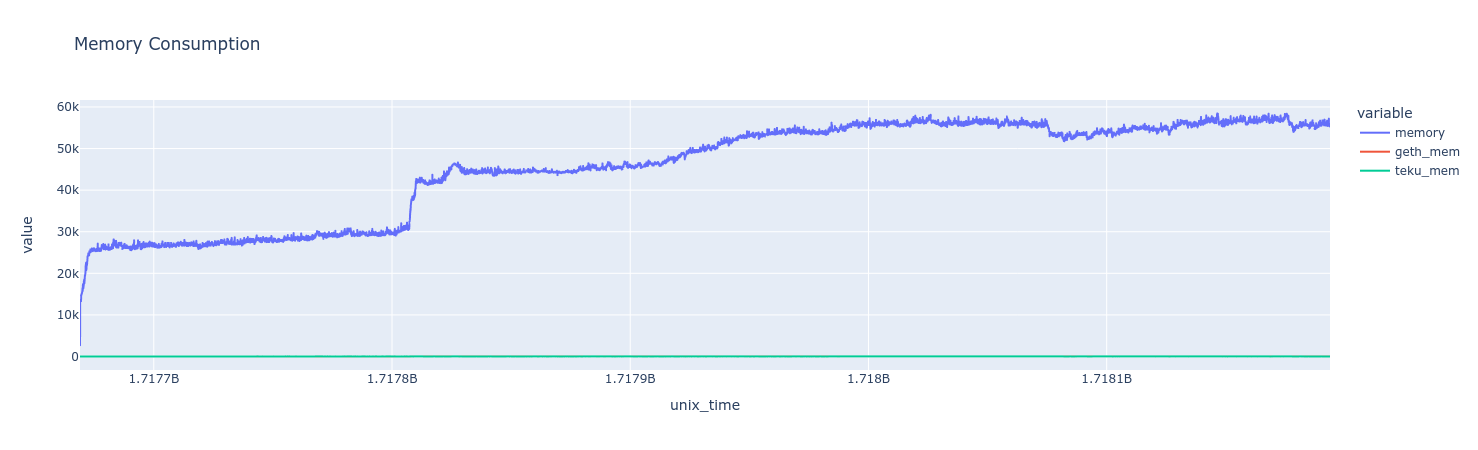
top -bn1, which capture the overall load average of CPU.Memory:
free -m, which monitor the overall memory usage.CPU and memory usage of a single process:
top -bn2 -d 0.2 -p $PID, which monitor the CPU and memory usage of Geth and Teku client in detail.System throughput:
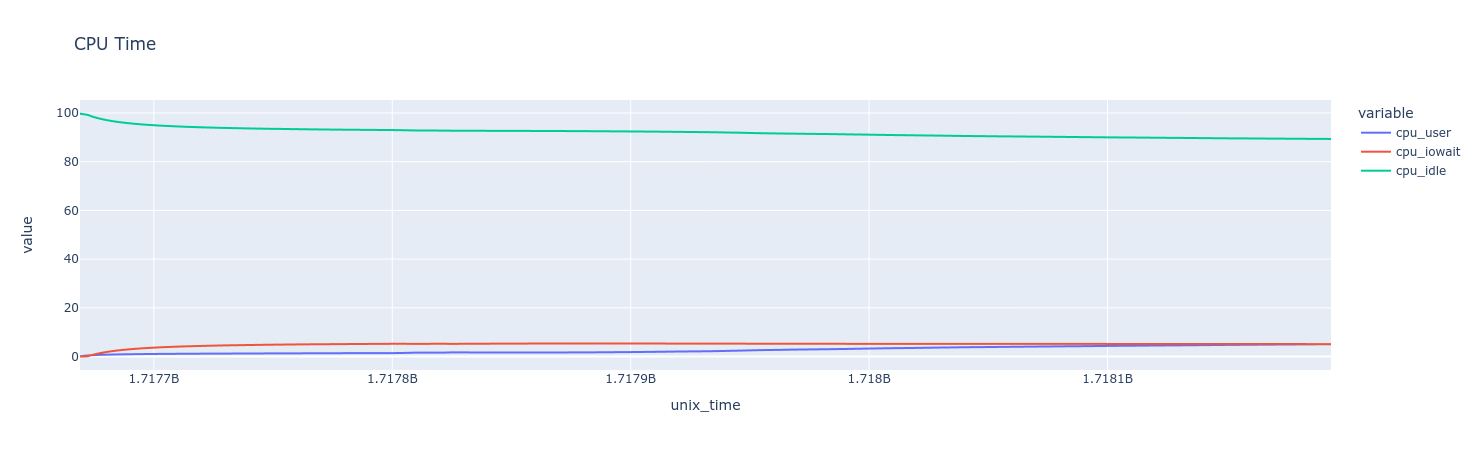
cat /proc/net/dev, which will capture the received and transmitted packets from the wired connection interface.CPU time:
iostat, which monitor the CPU time for user processes, system I/ODisk usage:
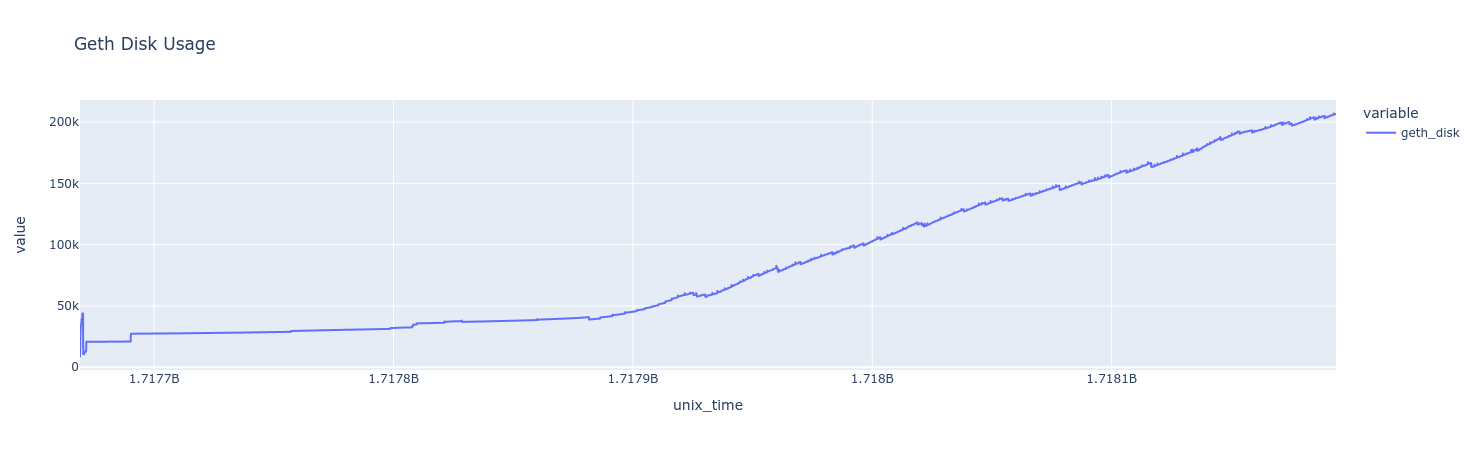
df -m, which monitor the disk space occupation for two clients.I/O for a specific disk:
iostat -dx $DISK, which monitor the I/O for two NVMe SSD disks.
Node Performance
Before synchronizing the Ethereum node, we run the monitoring system to capture the performance baseline. Afterward, we run both clients and collect performance data during synchronization, and visualize hardware performance with those metrics.
CPU Usage
Memory Consumption
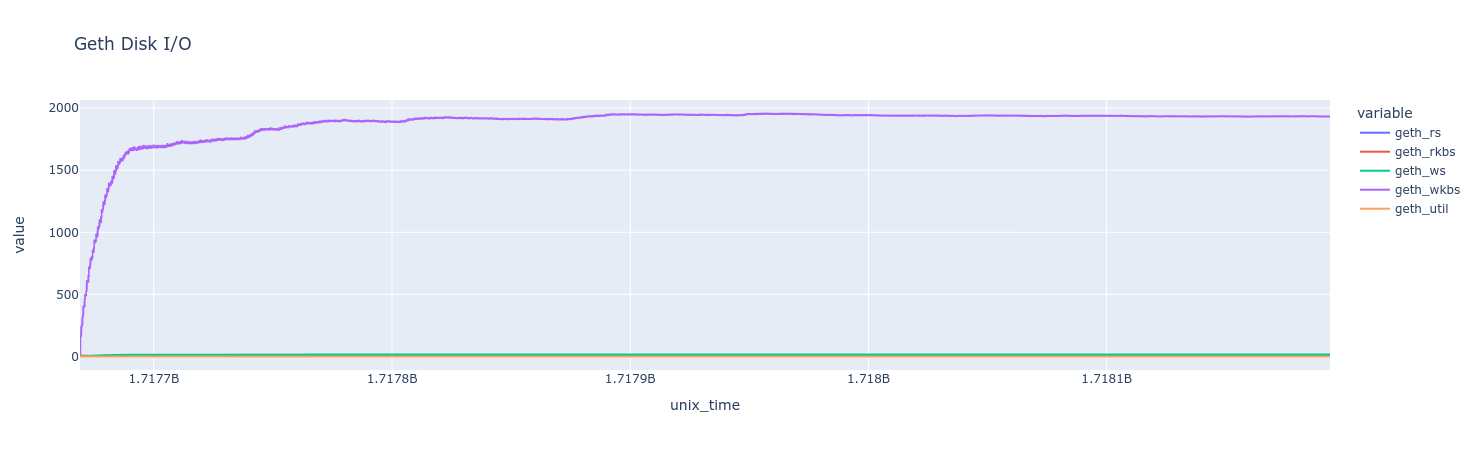
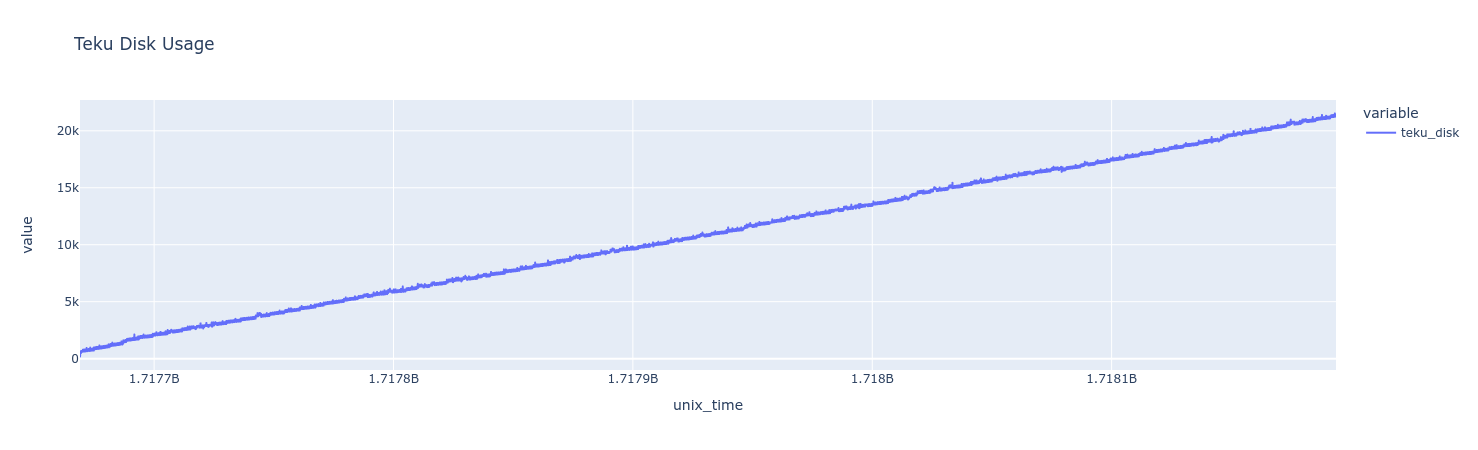
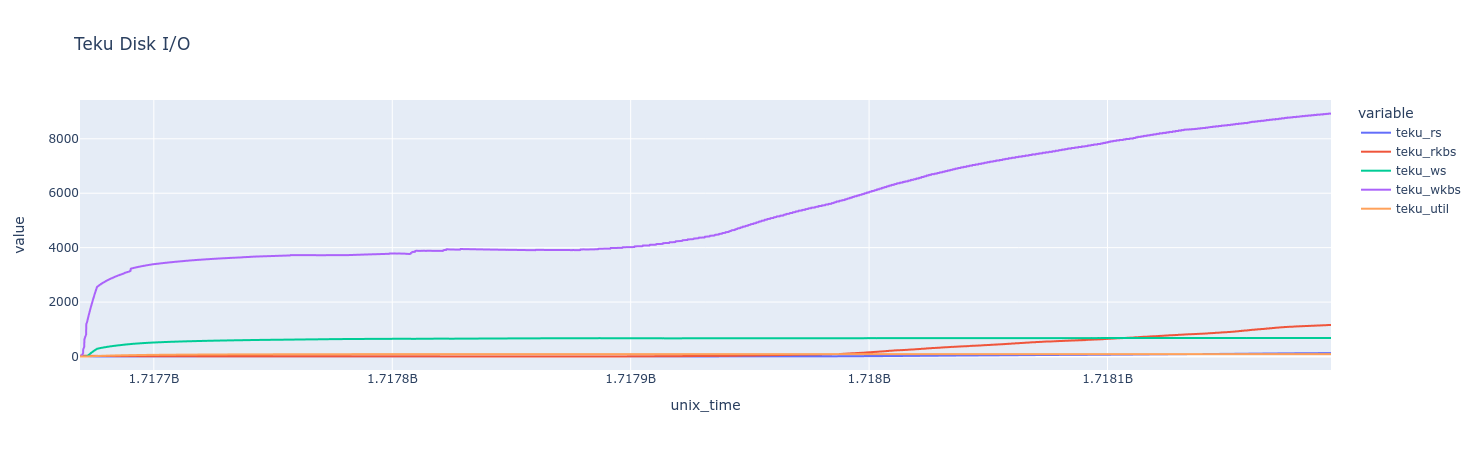
Disk I/O
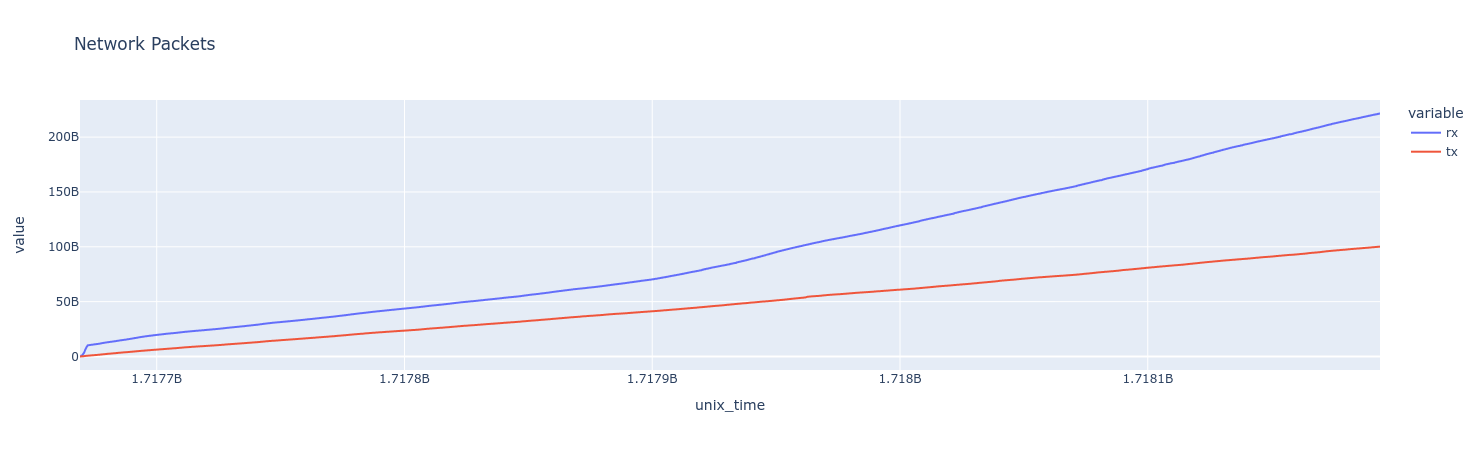
Network Bandwidth
 | A guest post by
|